Marketing Analyst
Atlas Copco Japan: B2B Win Rate and Revenue Modeling
Spring 2026
Challenge
Atlas Copco's Japan sales organization needed a statistically rigorous foundation for three connected questions. Which deal characteristics predict win probability? What revenue patterns repeat across the fiscal year? Which customer behaviors correlate with the highest revenue per month? The team built a coordinated three-model pipeline on opportunity-level Salesforce data and customer-month aggregated revenue, validated end-to-end against an independent SAS replication.
Methodology
Phase 1: Data Preparation Cleaned and reconciled 25,329 transaction records spanning July 2021 through March 2026. Full dataset: 25,329 transaction-level records. Win/loss analysis subset: 7,852 closed MVI and GIN opportunities with confirmed outcome labels. Revenue panel: 3,680 customer-month observations. Standardized categorical variables, applied log transformation to deal size to handle right skew, and imputed missing duration values with the median.
Phase 2: Three-Model Pipeline
Model 1: Revenue Drivers (Multiple Linear Regression). OLS on log monthly net revenue per end customer (n = 3,680). Customer Tier 1 (>=¥500M annual revenue) and Customer Tier 2 (¥100M to ¥500M) emerged as the dominant revenue predictors. Tier 1 accounts associated with roughly 7.85x the monthly revenue of Tier 3 baseline (β = 2.0612, p < 0.001). Source: step07_m1_mlr.py.
Model 2: Seasonality (STL Decomposition). Decomposed monthly revenue into trend, seasonal, and residual components. Confirmed Q3 (October through December) as the structural peak quarter and quantified the magnitude of the seasonal swing for inventory and pipeline planning. Source: step08_m2_seasonality.py.
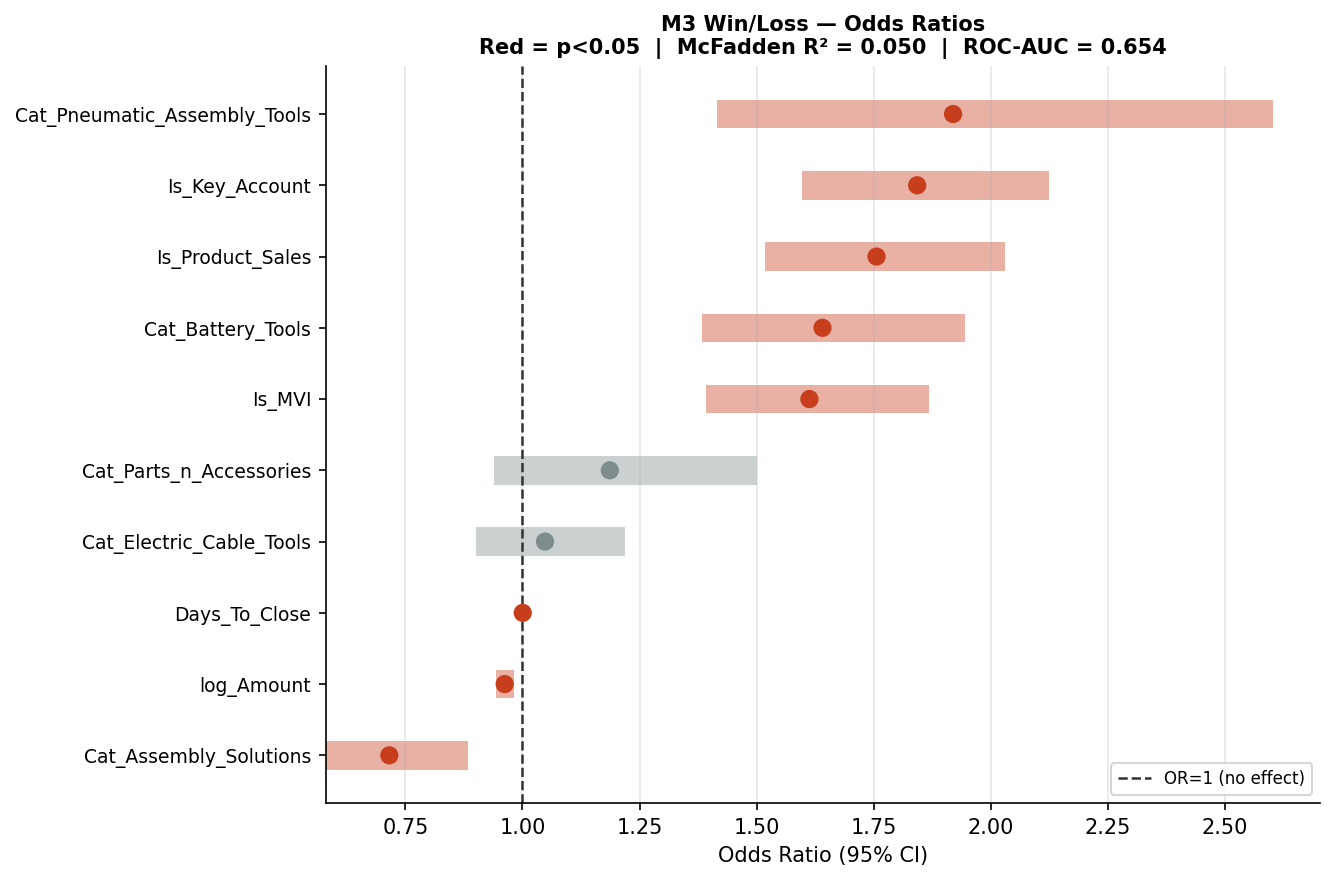
Model 3: Win/Loss Logistic GLM. Binary logistic regression on closed MVI+GIN opportunities (n = 7,852, baseline win rate 72.4%). Base specification (M3) covers the full period; an interaction specification (M3B) adds segment and competitor terms; a sensitivity specification (M3C) re-runs on post-2023 deals (n = 6,360) to test predictor stability. Replicated end-to-end in SAS PROC LOGISTIC; AIC, AUC, and win rate match Python output to three decimals. Source: step09_m3_logistic.py.
A separate revenue-association model (M5) tested whether customer-months with multiple product lines purchased show a revenue premium: the multi-product coefficient was β = 2.70 (p < 0.001), corresponding to e^2.70 = 14.88, approximately 15x the revenue of single-product months from accounts of similar tier and segment. This is an observed association, not a causal estimate; clustered standard errors are pending to address within-customer correlation across months.
Phase 3: Interpretation and Business Translation Converted log-odds and log-revenue coefficients into odds ratios and revenue multipliers for executive communication. Mapped each significant predictor to a sales or marketing action that could plausibly shift outcomes.
Key Findings
| Predictor | Odds Ratio | Significance | Business Implication |
|---|---|---|---|
| Competitor present (M3B interaction) | 0.092 | p < 0.0001 | When a competitor was logged on a deal, the odds of winning fell to roughly 9% of baseline (OR = 0.092). Largest single effect in the model; deals with logged competitors must trigger active support, not standard follow-up. |
| Pneumatic Assembly Tools | 1.919 | p < 0.001 | Strongest product-category win driver in the portfolio. |
| Key Account designation | 1.843 | p < 0.001 | Relationship-managed accounts win 84% more often; expanding the Key Account program is the highest-leverage sales investment identified. |
| Product Sales (vs. Project) | 1.756 | p < 0.001 | Simpler product-only deals win 76% more than multi-component projects; qualify project deals more aggressively or price for the conversion risk. |
| MVI (automotive) vs. GIN (industrial) | 1.613 | p < 0.001 | Atlas Copco wins 61% more in automotive than industrial; the gap widens further in post-2023 data (M3C: OR = 1.711). |
| Multi-product customer-month (M5) | ~15x revenue | p < 0.001 | Customer-months with multiple product lines purchased associate with approximately 15x the revenue of single-product months, controlling for tier, segment, and business line. Caveat: observed association, not a guaranteed cross-sell return. |
Deal duration was not a significant predictor in M3 (OR = 1.0005, marginal in the base model and non-significant in the post-2023 sensitivity); competitor presence dominated the model.
Model Validation
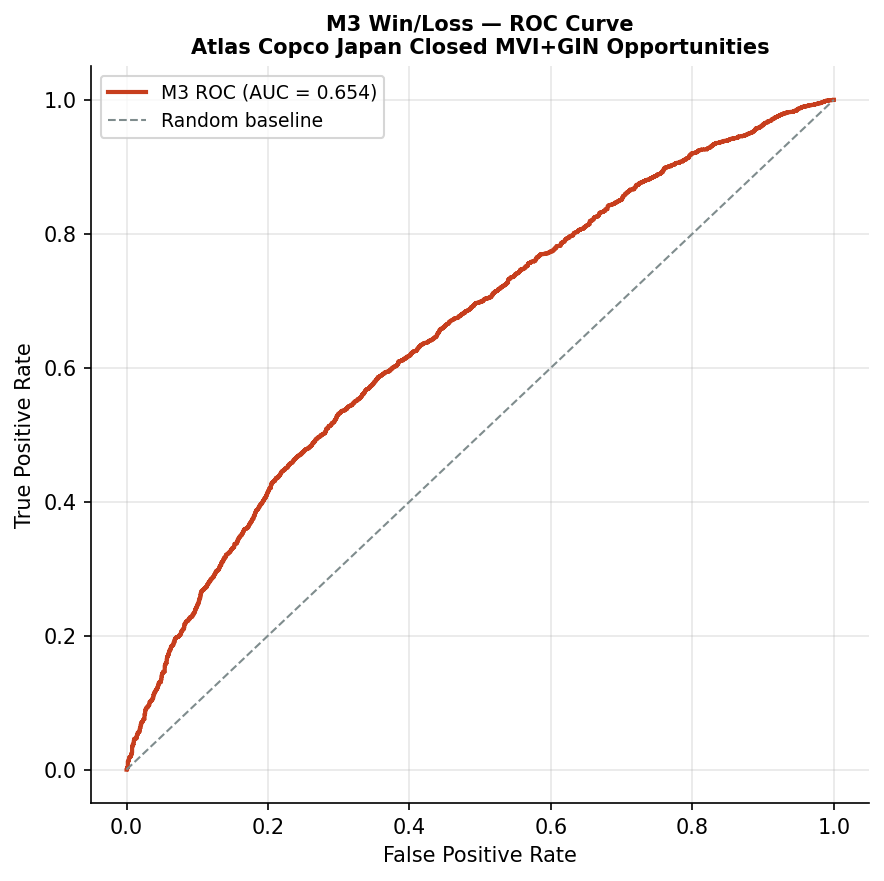
M3 base AUC = 0.654; M3B interaction AUC = 0.692; M3C post-2023 sensitivity AUC = 0.677. McFadden R² ranges from 0.05 (M3 base) to 0.10 (M3B). Hosmer-Lemeshow returns marginal calibration failure in M3B and M3C, which is expected at large n in interaction-heavy models; AUC remains the primary fit metric. SAS replication produces identical AIC and AUC to three decimals.
Seasonality Pattern
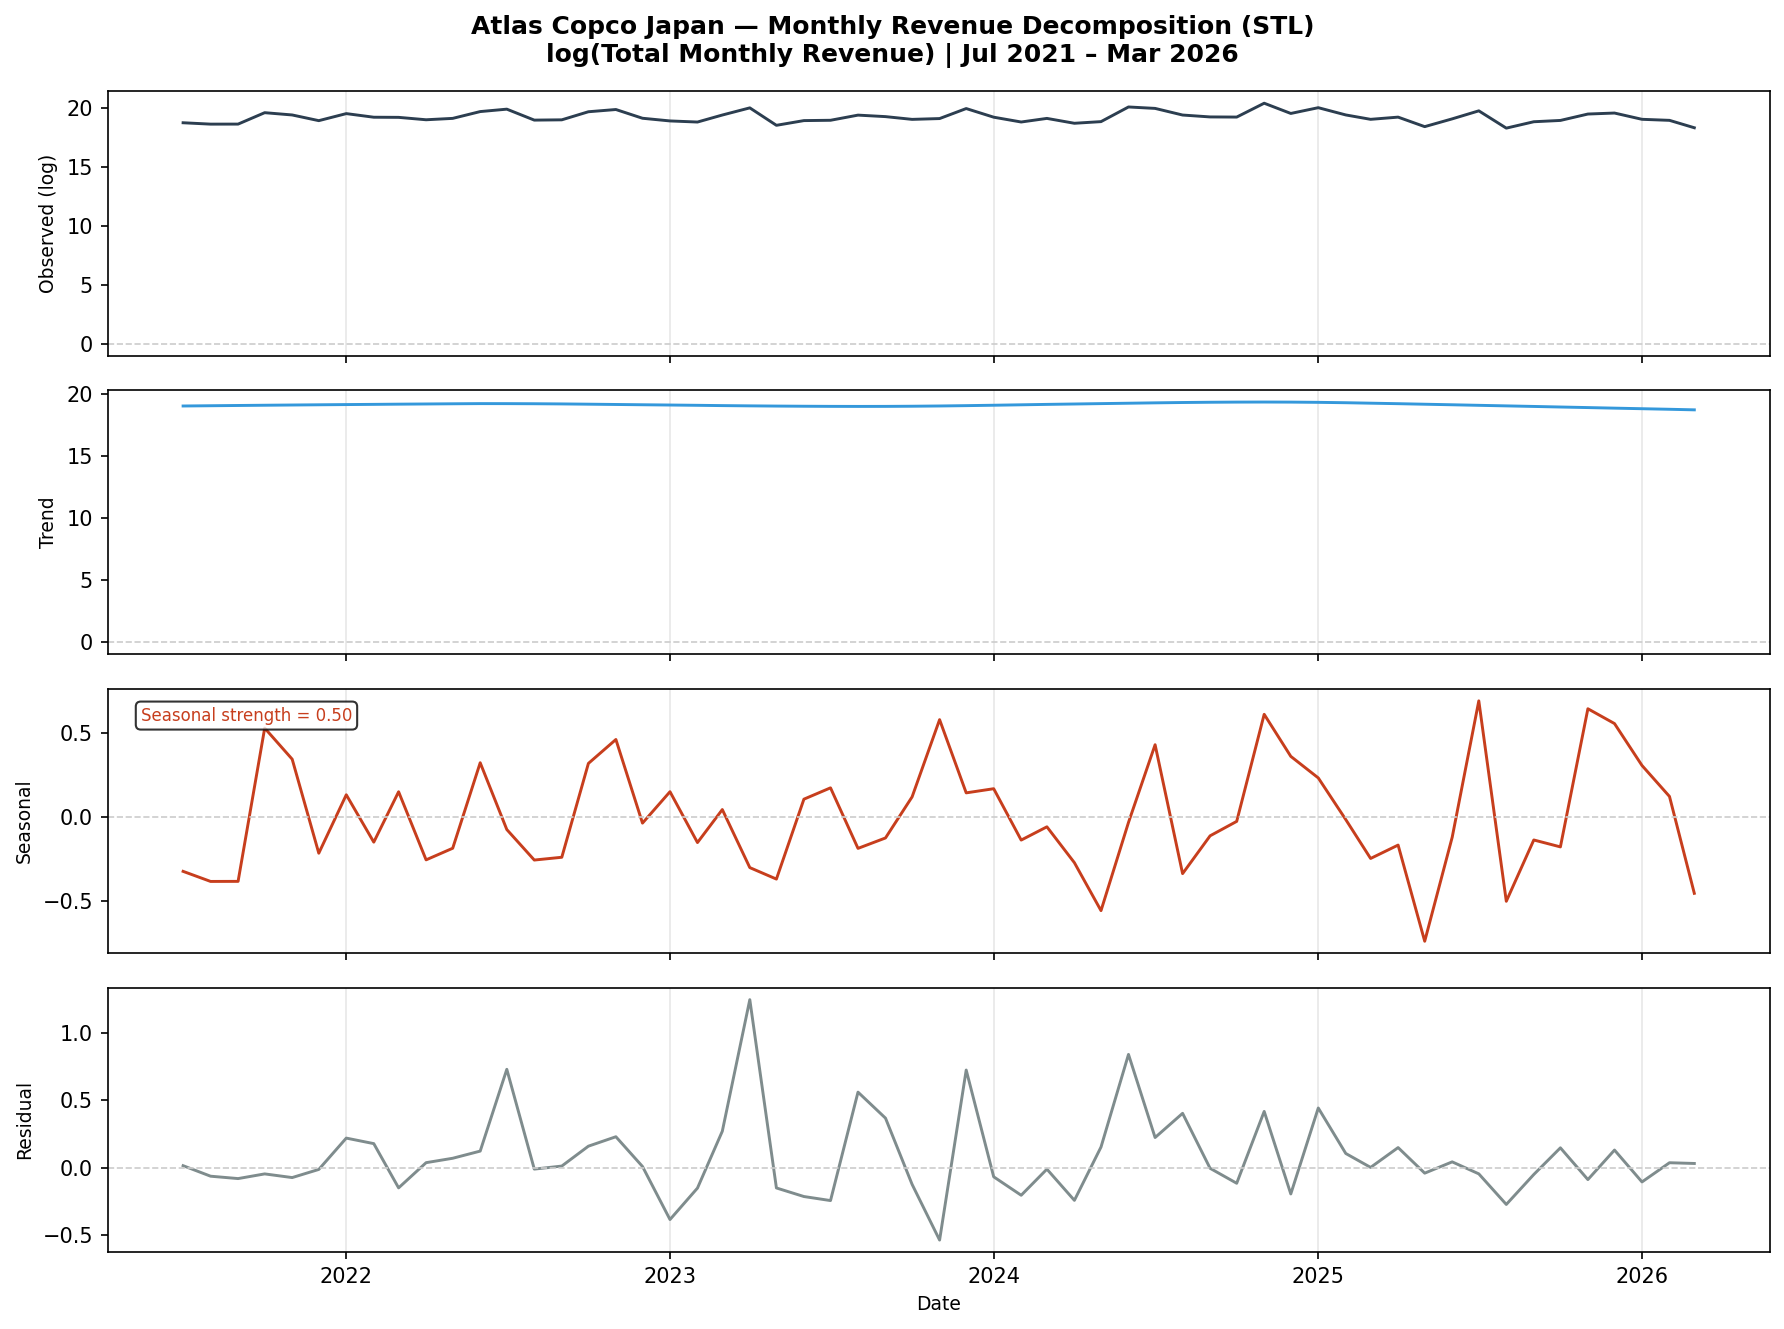
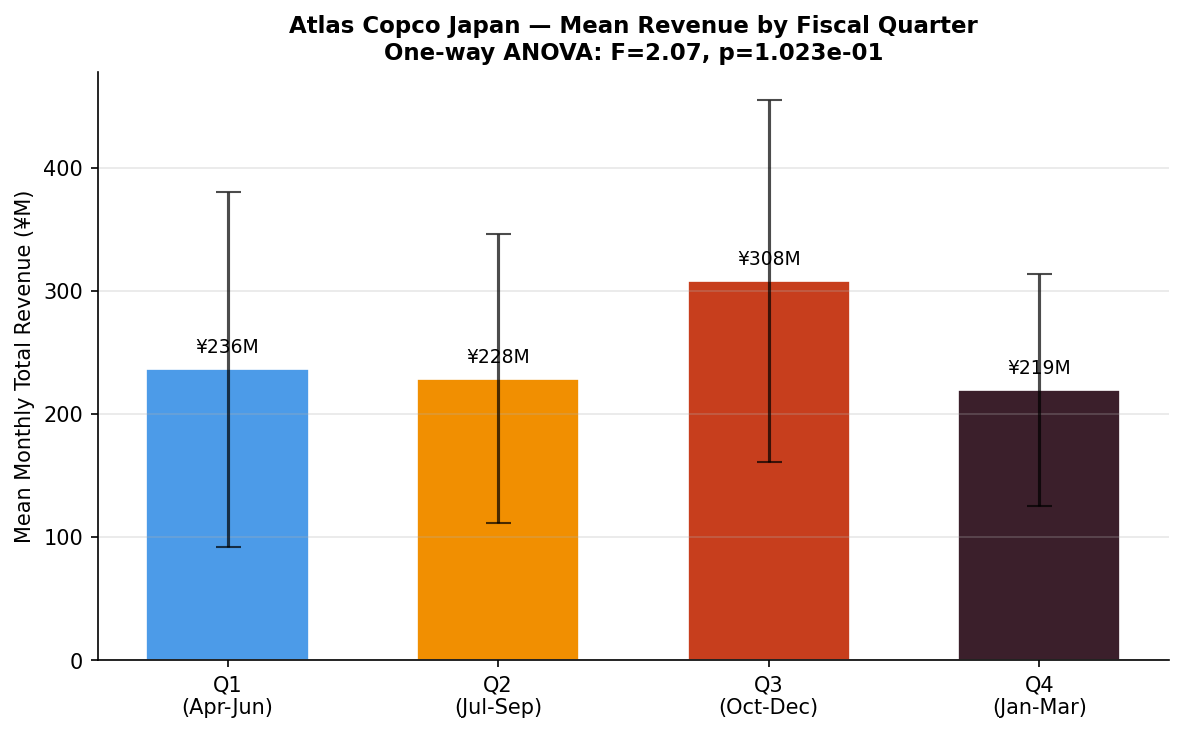
The STL decomposition isolates a recurring Q3 (October through December) revenue peak across fiscal years, separating it from the underlying trend and from random shocks. This supports a Q4 (January through March) inventory and pricing posture that anticipates the post-Q3 trough.
Revenue Drivers
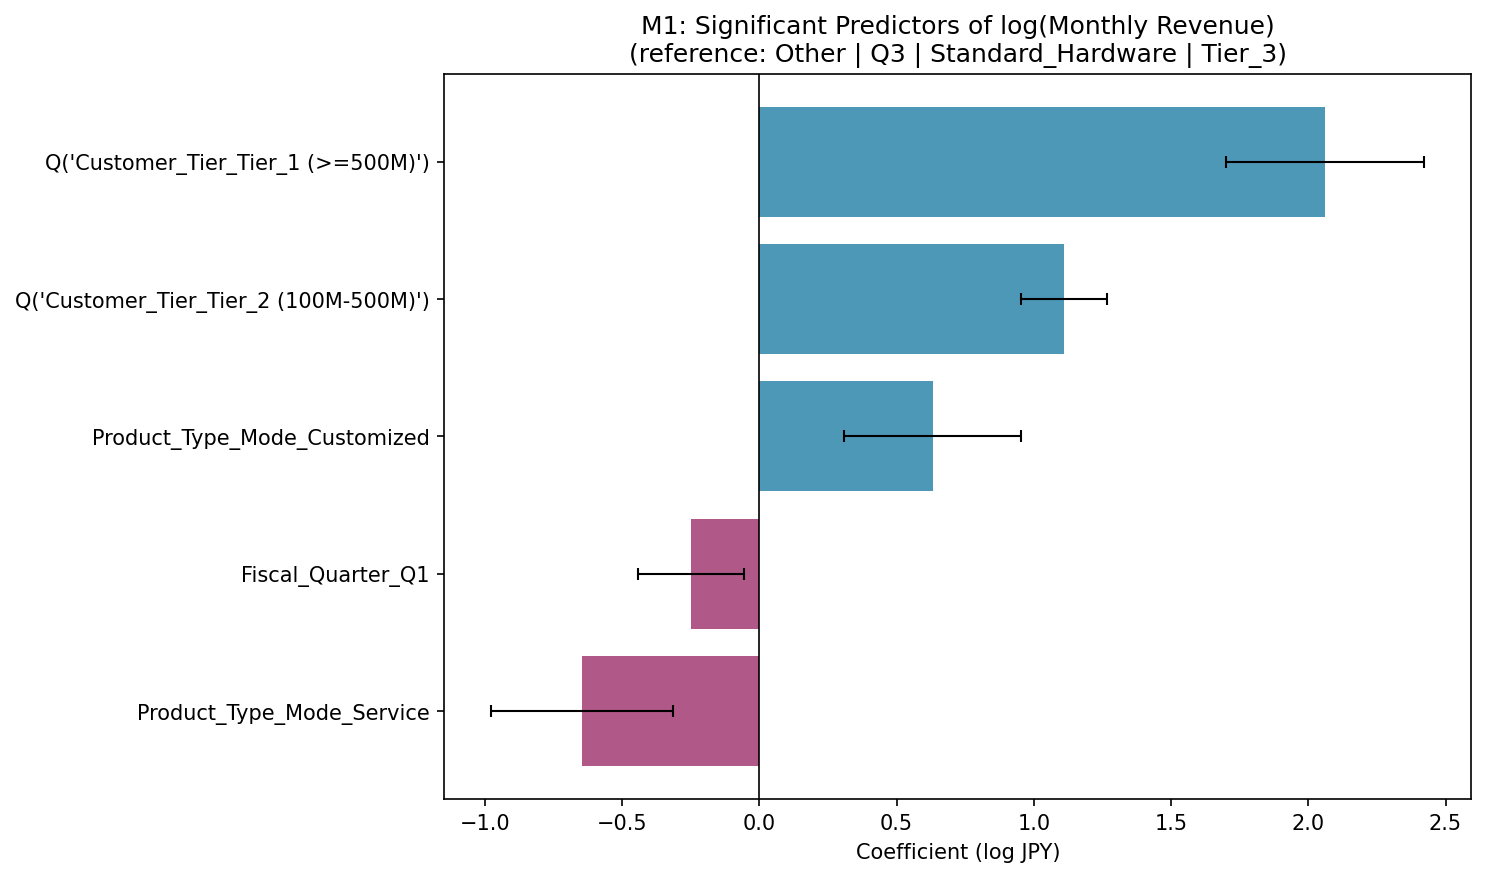
The MLR identifies Customer Tier as the dominant predictor of monthly revenue per customer, with Tier 1 (>=¥500M) accounts associated with approximately 7.85x the revenue of Tier 3 baseline. Product type also matters: customized hardware adds a positive premium; service contracts subtract from monthly revenue versus standard hardware.
Results and Impact
- Three validated models delivered for executive review and used in the team's QA growth roadmap submission
- SAS-Python pipeline parity established (n, AIC, AUC, win rate match to three decimals)
- M3C identified four predictors that have shifted since 2023: Days_To_Close lost significance; Battery Tools strengthened (+24%); the Assembly Solutions penalty disappeared; the MVI advantage widened. M3C coefficients are the recommended basis for forward-looking sales and marketing decisions
Tools Used
Python (Pandas, statsmodels) for feature engineering and model development; SAS PROC LOGISTIC and PROC GLM for production validation and replication; Excel for opportunity-level data preparation; Matplotlib for diagnostic plots.
What I Would Do Differently
Add a holdout validation set to report out-of-sample AUC. In-sample fit metrics are necessary but not sufficient for a model intended for ongoing scoring use. Compute clustered standard errors on M5 to address within-customer correlation across months, and treat the Customer Tier 1 revenue premium as directional until clustered SEs confirm significance. A confusion matrix at the optimal probability threshold would also strengthen the business case for deployment.
Practicum engagement context. Raw deal-level data and client-specific fields are summarized at the category level. Methodology and model structure are public; proprietary inputs are not.